ORE Gravity distribution Online, OREGON
The Wash ability Monitor OREGON was developed especially for the ore and coal preparation. This device determines the commodity parameters required for efficient preparation in short time and works without any chemicals.
The wash ability monitor utilizes a combination of optical and radiometric image analysis.
As a standard, ore and shelf are separated by differences in density. Pure shelf has a density which differs remarkably by the density of pure ore. However, raw material particles are a mixture of both and therefore the density is somewhere in between. Grinding of particles purifies the particles as ore or shelf but grinding is energy and cost intense and therefore undesired.
OREGON determines in a partial stream the density distribution in dependency of the particle size; this way the best set point for separation of the two fractions can be determined.
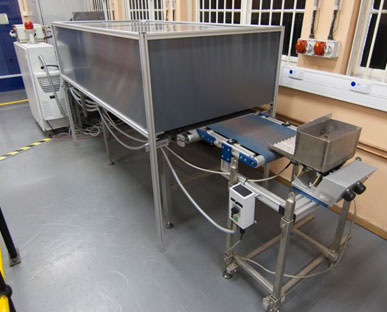
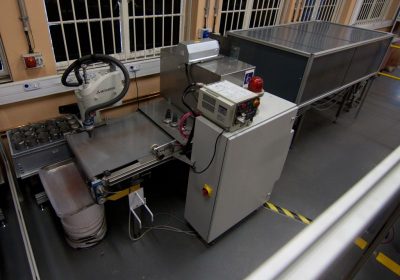
The sample to be analyzed is fed over a small conveyor belt:
First the particle size distribution is evaluated optically. This is accomplished by determining the particle size (3 dimensions) and volume for each individual particle using laser triangulation on the conveyor belt.
All particle measures are stored in a database.
In a second step the density distribution is analyzed using an x-Ray measuring path. The measured radiation distribution is used to determine the weight distribution (mass per area) for each particle and is also stored in the database. The measurement is very similar to a medical X-Ray examination. Bones which have high density absorb the radiation stronger than flesh where the density is smaller.
Therefore bones are shown brighter than the flesh on x-Ray images. Basically, this image does not show the density but the mass per area which was transmitted by the radiation. Finally the combination of both (optical and radiometric)measurements gives the density of each particle.
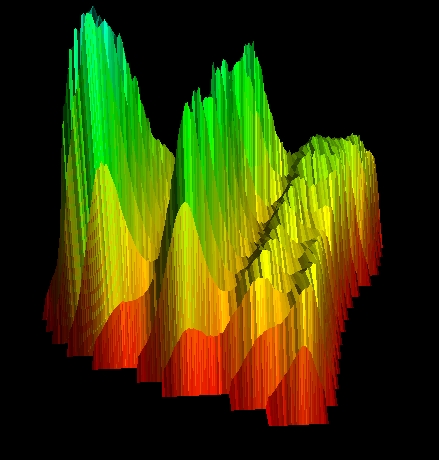
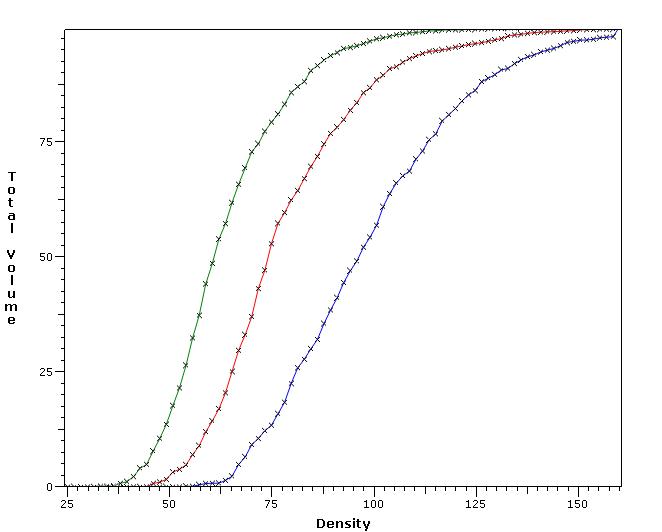
Given the fact that the information about every single particle is stored in a database and can be retrieved easily the evaluation of the sample can be done using different criteria. Beside distribution functions like mass vs. density or volume vs. density even geometrical parameters can be evaluated. Outliers can be easily identified and evaluated just by a click on the data point.
Optionally the particles can be sorted at the end of the belt according to their size or density for further evaluation. Also additionally measurement pathes are optionally available.
The evaluation of the measured data is done with the RACCOON software.